
Procedural Image Generator
Easily create procedural images from basic shapes and trigonometric functions with this powerful online tool.
Procedural generation parameters
Procedurally generated image:
What is Procedural Image Generator?
This is a free online tool to create images procedurally from basic shapes and mathematical formulas. You can quickly create images by experimentation, changing different parameters, some of them defined with math equations.
It uses procedural generation to create images and allows you to create generative art and algorithmic art.
How it works
You start by choosing a source shape. It can be a circle, ellipse, triangle, square, rectangle, polygon, star or line.
To build the final image, the source shape that you choose will be drawn multiple times in the canvas, with different variations in position, size, color, angle, transparency and other attributes.
These variations in position and other attributes will follow the math equations that you choose. These math equations tipically contains trigonometric functions, but can also contain any math functions and operators.
For each shape you can choose different attributes to vary during the image generation. For example, the circle can vary the radius and stroke width, while the star shape can vary the star inset, rotation, radius and line width. For every shape you can also vary the position (x and y), color (r, g and b) and alpha (transparency).
After choosing the shape, you also need to choose the number of times the shape will be drawn and the draw type (stroke or fill). Then you choose the math equations that will be used to determine the shape position, color, transparency and other parameters.
The equations can contain the variable "i". This variable represents the current iteration in the loop, where the first shape will be rendered using i=0, the second shape with i=1, the third shape with i=2, and so on.
There are two equations for the shape position: x and y. The equation for "x" is for the position in the horizontal axis and the equation for "y" is for the position in the vertical axis. The values are in pixels.
There are three equations for the shape color: R (red), G (green) and B (blue). The color is determined using the RGB color model, and each color component (red, green and blue) must be in the range between 0 and 255. If the RGB value is outside this range, it will be automatically adjusted to be in that range, based on the selected configuration (bounce, clamp or remainder).
How to use this online tool
- Choose the image width and height.
- Choose the shape and the draw type (stroke or fill).
- Choose the number of times that the shape will be drawn.
- Choose the math equations for the shape position (x and y), color (r, g, b), alpha (transparency) and other attributes, depending on the selected shape.
- Optionally, you can configure coordinates offset and zoom.
- Choose the background color or select "transparent background".
- The image will be automatically drawn in the canvas whenever you change any configuration attribute. You can keep changing attributes to experiment until you get an image you are satisfied.
- Click the button "download image" to download the generated image in PNG format.
Configuration parameters
Image size
| Field | Description |
|---|---|
| Image width | The width of the image, in pixels. |
| Image height | The height of the image, in pixels. |
Draw elements
| Field | Description |
|---|---|
| Shape | The shape that will be used to build the image. It can be a circle, ellipse, triangle, square, rectangle, polygon, star or line. |
| Draw type | Can be stroke or fill. For all shapes, except line. |
| Number of sides | Number of sides of the polygon. Only for polygon shape. |
| Star points | Number of star points. Only for star shape. |
Iteration
| Field | Description |
|---|---|
| Number of (shapes) to draw | The number of times the choosen shape will be drawn in the canvas to build the final image. |
| Initial value for "i" variable | In the math equations, you can use the "i" variable. Here you can configure the initial value for this variable. The default value is 0. |
| Increment for "i" variable | For every step in the iteration, the variable "i" is incremented by the amount configured here. The default value is 1. |
Math equations
In any equation, you can use the variable "i", for the current iteration in the loop. For example, i * 0.01.
You can also use Javascript math functions, like "Math.sin()", "Math.cos()", "Math.sqrt() and "Math.random()", or the equivalent short versions, like "sin()", "cos()", "sqrt()" and "random()". See the "Useful math functions" section below for the full list of math functions.
Any parameter below can also be a static number instead of an equation, if you don't want the parameter to vary.
| Field | Shapes | Description |
|---|---|---|
| x | all shapes | The horizontal position that the shape will be drawn in the canvas, in pixels. |
| y | all shapes | The vertical position that the shape will be drawn in the canvas, in pixels. |
| radius | circle, triangle, square, polygon and star | The radius of the circle. It's also used for other shapes. |
| ellipse radius X | ellipse | The ellipse horizontal radius, in pixels. |
| ellipse radius Y | ellipse | The ellipse vertical radius, in pixels. |
| rectangle width | rectangle | The width of the rectangle, in pixels. |
| rectangle height | rectangle | The height of the rectangle, in pixels. |
| star inset | star | The inset defines if the star is more or less pointy and sharp. The default value is 2.5. |
| R | all shapes | The equation for the red color channel. Must evaluate to a number between 0 and 255. If the equation evaluates to a value outside this range, the value will be automatically adjusted to be in that range, based on the selected configuration (bounce, clamp or remainder). |
| G | all shapes | The equation for the green color channel. Must evaluate to a number between 0 and 255. If the equation evaluates to a value outside this range, the value will be automatically adjusted to be in that range, based on the selected configuration (bounce, clamp or remainder). |
| B | all shapes | The equation for the blue color channel. Must evaluate to a number between 0 and 255. If the equation evaluates to a value outside this range, the value will be automatically adjusted to be in that range, based on the selected configuration (bounce, clamp or remainder). |
| line width | all shapes | The width of the stroke when drawing the shapes. |
| line length | line | The length of the line. |
| rotation | all shapes except circle | The shape angle, in radians. |
| alpha | all shapes | The shape transparency. Must evaluate to a number between 0.0 (fully transparent) and 1.0 (fully opaque). |
Blend mode
| Field | Description |
|---|---|
| Blend mode | The blend mode sets the type of compositing operation to apply when drawing shapes. It sets how a new shape will be drawn over the drawings that are already drawn on the canvas. For more information check these links: Blend Modes (Wikipedia), globalCompositeOperation (MDN Web Docs) and globalCompositeOperation (w3schools). |
Additional configuration
| Field | Description | ||||||||
|---|---|---|---|---|---|---|---|---|---|
| Behaviour when RGB value is outside range [0-255] | The equations for R (red), G (green) and B (blue) must evaluate to numbers in the range between 0 and 255, for any iteration in the loop. For any iteration, if an equation evaluates to a value outside this range, the value will be automatically adjusted to be in that range, based on the selected configuration (bounce, clamp or remainder). This parameter determines how the values will be adjusted to belong to the range, when needed.
| ||||||||
| Behaviour when radius is negative | Some shapes have the "radius" parameter. This parameter must be a positive number or zero. For any iteration, if the equation of the radius parameter evaluates to a negative number, it will be converted to a positive number or zero, based on the selected configuration (use absolute value or set value to zero).
|
Coordinates
| Field | Description |
|---|---|
| Origin | The coordinates origin (0,0). Can be "top left" or "center". |
| Offset x | The "x" coordinate offset, in pixels. It determines the horizontal position of the "camera". Adjusting this offset lets you easily shift the view or "move" the camera without changing the math equations "x" and "y". |
| Offset y | The "y" coordinate offset, in pixels. It determines the vertical position of the "camera". Adjusting this offset lets you easily shift the view or "move" the camera without changing the math equations "x" and "y". |
Zoom
| Field | Description |
|---|---|
| Zoom | Changing this parameter allows you to easily "zoom in" or "zoom out" without changing the math equations "x" and "y". |
Background
| Field | Description |
|---|---|
| Transparent background | If this option is checked, the image will be have transparent background when downloaded. |
| Background color | The background color, in hexadecimal value. For example, use #000000 for a black background. |
Useful math functions
Below are some examples of useful Javascript mathematical functions that you can use in the equations.
| Math function (Javascript) | Alias (short version) | Description | Usage example |
|---|---|---|---|
| Math.sin() | sin() | Returns the sine of a number in radians. | sin(i/20) * 255 |
| Math.cos() | cos() | Returns the cosine of a number in radians. | cos(0.01 * i) * 255 |
| Math.atan() | atan() | Inverse tangent, in radians. | atan(0.01 * i) * 255 |
| Math.atan2() | atan2() | Returns the angle in the plane (in radians) between the positive x-axis and the ray from (0, 0) to the point (x, y), for Math.atan2(y, x). | atan2(i, 100) * 200 |
| Math.pow() | pow() | Returns the value of a base raised to a power. | pow(i, 3) |
| Math.random() | random() | Returns a pseudo-random number that's greater than or equal to 0 and less than 1, with approximately uniform distribution over that range. | random() * 255 |
| Math.sqrt() | sqrt() | Returns the square root of a number. | sqrt(i) * 100 |
| Math.tan() | tan() | Returns the tangent of a number in radians. | tan(i*0.01) * 255 |
| Math.abs() | abs() | Returns the absolute value of a number. | abs(-100) |
For a full list of Javascript mathematical functions, check Javascript documentation here and here.
Math constants
Below are some Javascript mathematical constants that you can use in the equations.
| Math constant | Description | Usage example |
|---|---|---|
| Math.PI | The ratio of the circumference of a circle to its diameter (approximately 3.14159). | 2 * Math.PI |
| Math.E | Euler's number, the base of natural logarithm and exponential function (approximately 2.71828). | Math.E * i |
Examples
Below are some examples of images generated with this online tool, together with the equations used and other parameters.
You can click on any image below to use it's parameters as a template and start creating your own procedural images by editing those parameters.
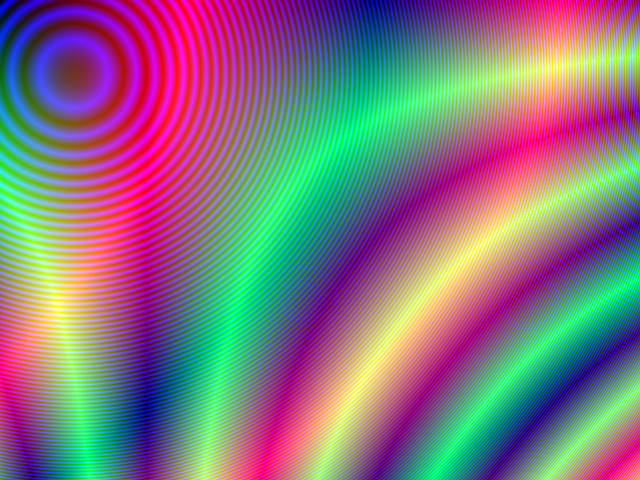
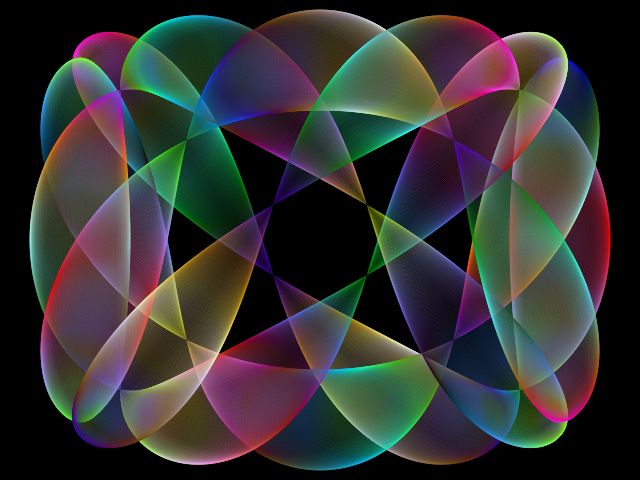
Example 1
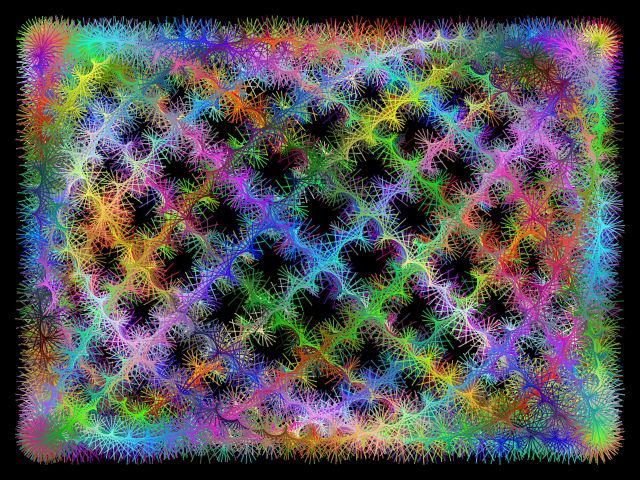
This image was generated from 26000 lines, drawn at different positions, with different colors, angles and line lengths.
Equations for line position (x and y), angle and line length:
x = sin(i * 2.723) * 280
y = cos(i * 3.77) * 200
lineLength = sin(i*10) * 50
angle = i * 100
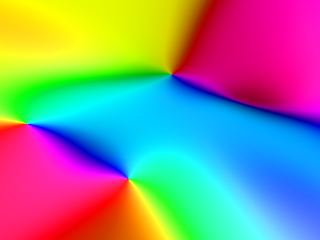
Example 2
This image was generated from 6280 circles, drawn at different positions and with different radius and colors.
The equations for position, radius and color are:
x = cos(i * 0.003) * 240
y = sin(i * 0.005) * 180
radius = abs(cos(i * 0.008)) * 50
red = 255 + i * 1.1
green = i * 1.7
blue = i * 3
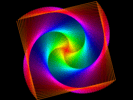
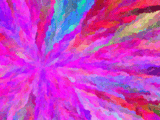
Example 3
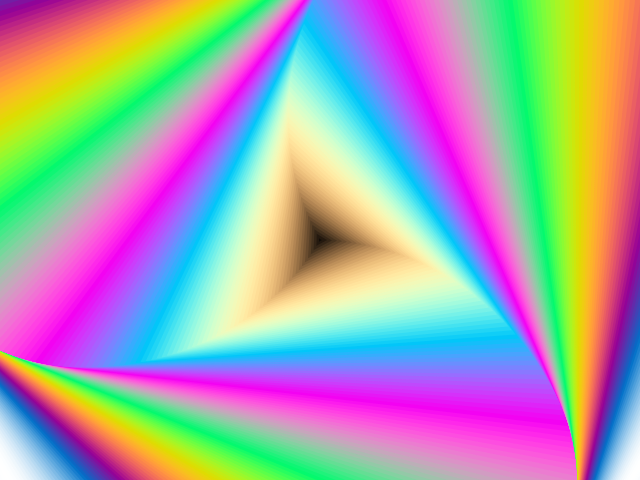
This image was generated from 200 triangles, drawn with different colors, sizes and angles.
The equations for position, radius, angle and color are:
x = 0
y = 0
radius = i * 5
angle = i * 0.01
red = sin(i*0.07)*255
green = sin(i*0.05)*255
blue = sin(i*0.03)*255
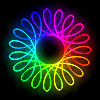
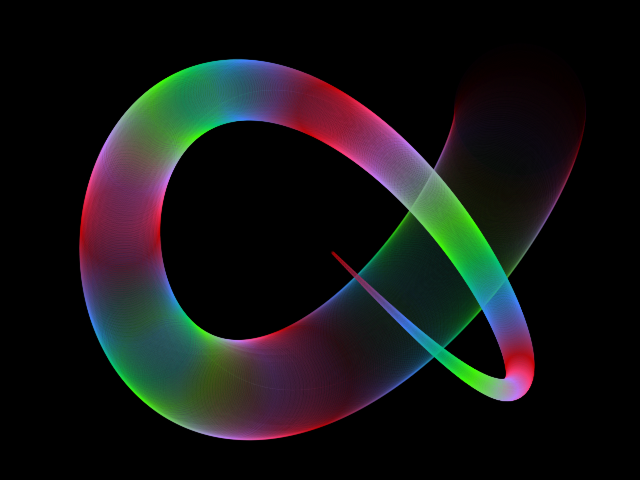
Example 4
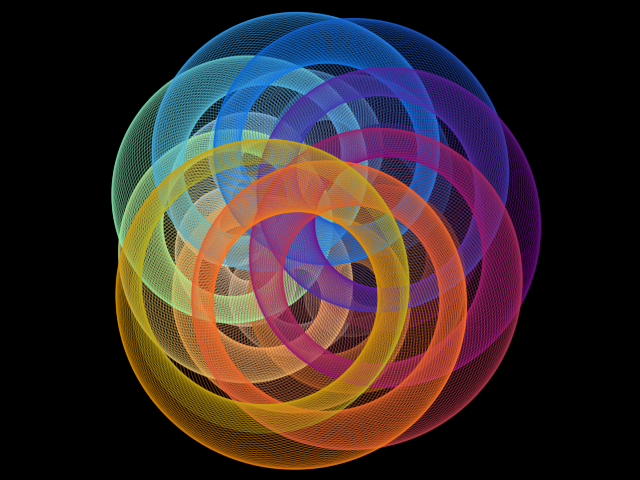
This image was generated from 1500 circles, drawn at different positions and with different radius and colors.
The equations for circle position and radius are:
x = cos(i/100) * 100 + cos(i * 0.08) * 30
y = sin(i/100) * 100 + sin(i * 0.08) * 30
radius = i * 0.1
Related tools